9. Four curves A, B, C and D are drawn in the adjoining figure for a given amount of gas. The curves which represent adiabatic and isothermal changes are
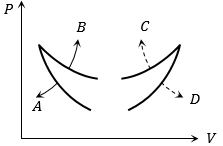
(a) C and D respectively
(b) D and C respectively
(c) A and B respectively
(d) B and A respectively
Answer-c
(53)
5/5 - (3 votes)
Related Posts:
- @@ SSC CGL (Tier - 2) Online Exam Paper - 2017 "held…
- ## SSC CGL (Tier - 2) Online Exam Paper - 2017 "held…
- SSC CGL (Tier - 2) Online Exam Paper - 2017 "held on…
- The Living World 2
- GROWTH OF HUMAN POPULATION
- ORGANISMS AND ENVIRONMENT
- PCS COACHING IN PUNJAB @ FLAME INSTITUTE
- POLLUTION
- Genetis Lecture 1
- Genetics Lecture 2
You may also like
(a) – 5 J (b) – 10 J (c) – 15 J (d) – 20 J Answer-a (64)
(a) 34 J (b) 70 J (c) 84 J (d) 134 J Answer-d (84)
10. In pressure-volume diagram given below, the isochoric, isothermal, and isobaric parts respectively, are
5 September, 2022
(a) BA, AD, DC (b) DC, CB, BA (c) AB, BC, CD (d) CD, DA, AB Explanation-(d) Process CD is isochoric as volume is constant, Process DA is isothermal as temperature constant and Process AB is isobaric as pressure is …