Brand new Course Package released! Get 99% off your first purchase with code “99”.
Find out more!
Back
User Login
Package
Subjectwise
Refund and Returns Policy
Term Conditions
Profile
Delete my account
✕
Search
0
Shopping cart
Close
No products in the cart.
Home
Physics
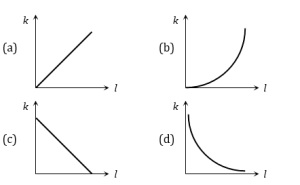
6. Which of the following graph depicts spring constant k versus length l of the spring correctly
6. Which of the following graph depicts spring constant k versus length l of the spring correctly
Ans. d
(6)
5/5 - (6 votes)
Prev
Previous
7. A particle of mass m moving with velocity u makes an elastic one dimensional collision with a stationary particle of mass m. They are in contact for a very short time T. Their force of interaction increases from zero to F0 linearly in time T/2, and decreases linearly to zero in further time T/2. The magnitude of F0 is
Next
48. The moment of inertia of a rod (length l, mass m) about an axis perpendicular to the length of the rod and passing through a point equidistant from its mid point and one end is
Next
Free नीट कोर्स हिंदी में | NEET course in Hindi
Feb 10, 2025
BIOLOGY
Click Here for Hindi medium NEET Course (252)
Career counsellors in Chandigarh Online Offline
Feb 4, 2025
About Us
Best Career Counsellors in Chandigarh – Transform Your Future with Flame Institute In today’s competitive world, choosing the right career...
Best Physics teacher in Chandigarh Mohali India
Sep 17, 2024
Physics
Best Physics coaching Teacher in Chandigarh Mohali At Flame Institute, our physics teacher is highly experienced, specializing in preparing students...
12. An ideal gas is taken through the cycle A→ B → C → A, as shown in the figure. If the net heat supplied to the gas in the cycle is 5 J, the work done by the gas in the process C → A is
Sep 5, 2022
Physics
(a) – 5 J (b) – 10 J (c) – 15 J (d) – 20 J Answer-a (126)
error:
Content is protected !!