Brand new Course Package released! Get 99% off your first purchase with code “99”.
Find out more!
Back
User Login
Package
Subjectwise
Refund and Returns Policy
Term Conditions
Profile
Delete my account
✕
Search
0
Shopping cart
Close
No products in the cart.
Home
Physics
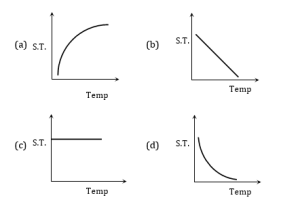
3. Which graph represents the variation of surface tension with temperature over small temperature ranges for water
3. Which graph represents the variation of surface tension with temperature over small temperature ranges for water
Ans. b
(8)
5/5 - (1 vote)
Prev
Previous
1. The graph shown was obtained from experimental measurements of the period of oscillations T for different masses M placed in the scale pan on the lower end of the spring balance. The most likely reason for the line not passing through the origin is that the
Next
2. A graph is shown between stress and strain for a metal. The part in which Hooke’s law holds good is
Next
Free नीट कोर्स हिंदी में | NEET course in Hindi
Feb 10, 2025
BIOLOGY
Click Here for Hindi medium NEET Course (252)
Career counsellors in Chandigarh Online Offline
Feb 4, 2025
About Us
Best Career Counsellors in Chandigarh – Transform Your Future with Flame Institute In today’s competitive world, choosing the right career...
Best Physics teacher in Chandigarh Mohali India
Sep 17, 2024
Physics
Best Physics coaching Teacher in Chandigarh Mohali At Flame Institute, our physics teacher is highly experienced, specializing in preparing students...
12. An ideal gas is taken through the cycle A→ B → C → A, as shown in the figure. If the net heat supplied to the gas in the cycle is 5 J, the work done by the gas in the process C → A is
Sep 5, 2022
Physics
(a) – 5 J (b) – 10 J (c) – 15 J (d) – 20 J Answer-a (126)
error:
Content is protected !!